|
|
| Line 37: |
Line 37: |
|
| |
|
|
| |
|
| = Analyze dump (coders only) =
| | Coders might want to check out the article on [[Analyze_a_Memory_Dump|analyzing a memory dump.]] |
| | |
| You received a crash dump and don't know how to analyze it?
| |
| That's not a big deal, really.
| |
| Don't get scared by numerous references to WinDbg and CDB in relation to memory dumps!
| |
| You can open dumps directly in Visual Studio debugger.
| |
| | |
| Before starting, you might want to read [https://docs.microsoft.com/en-us/windows-hardware/drivers/debugger/user-mode-dump-files Microsoft docs about memory dumps], so that understand what it is and what is included.
| |
| | |
| ===== Learn version =====
| |
| First of all, you need to know which exact version of program the memory dump was obtained from. You should learn the exact state of source code, and build platform + configuration.
| |
| | |
| Here are some options:
| |
| * TheDarkMod final release: ask the TDM version, like 2.07.
| |
| * TheDarkMod beta release: ask when player has updated TDM last time. Or ask him to attach console dump. Or ask him to open game console and look at the revision number there.
| |
| * TheDarkMod developer build: ask developer about source code revision, platform and configuration.
| |
| | |
| Bitness is not important: you will know it immediately when you open the dump.
| |
| | |
| ===== Get source code =====
| |
| Get the matching version of source code. In the case of TDM game or updater, you most likely need to switch to specific revision on the release branch/tag.
| |
| | |
| ===== Get debug symbols =====
| |
| This is the hardest part: you need the debug symbols (i.e. the PDB files) for the binaries from which the memory dump was saved.
| |
| | |
| Every PDB and DMP file contains checksum of executable, and normally you cannot use PDB for memory dump if the checksums don't match, just like you cannot use a PDB to debug a program if it does not match. Merely rebuilding the project is enough to break PDB compatibility.
| |
| | |
| Here are some options:
| |
| * TheDarkMod final release: find PDBs in <tt>devel/release/debugging/X.YZ/</tt> in assets SVN, and unpack them.
| |
| * TheDarkMod beta release: ask release manager to upload PDBs somewhere (he usually saves them).
| |
| * TheDarkMod developer build: ask developer to upload the matching PDB.
| |
| | |
| If you cannot get the original PDB but have the original executable, then you can also try to force-load freshly built PDBs. Here are the steps:
| |
| # Get exactly matching source code, compiler, target, configuration, whatever else.
| |
| # Build new binaries (fresh rebuild advised).
| |
| # Find the created PDB files and use [http://www.debuginfo.com/tools/chkmatch.html chkmatch -m] to substitute checksum inside PDB.
| |
| | |
| Of course, using mismatched PDB can lead to all sort of issues during debugging.
| |
| | |
| | |
| === Action ===
| |
| | |
| Open the solution in Visual Studio (instructions written against VS2017).
| |
| | |
| In menu: "File -> Open -> File...". Choose the memory dump file.
| |
| | |
| [[File:crashdump_1_open.png|border|700px]]
| |
| | |
| You will see some general info, most of which is useless. Click <u>Debug with Native Only</u> link in the top-right corner.
| |
| | |
| [[File:crashdump_2_pdb.png|border|700px]]
| |
| | |
| Most likely you will see this screen about missing PDB. Click on <u>Browse and find xxx.pdb...</u> link. Find the directory where the PDB file is located.
| |
| | |
| Visual Studio will accept debug symbols immediately when you open the directory containing them. Make sure the PDB files are unpacked.
| |
| | |
| [[File:crashdump_3_result.png|border|700px]]
| |
| | |
| Now you should see where execution stopped, probably exception code also, You can navigate readable call stack, inspect global and local variables.
| |
| | |
| Everything you can normally do in Visual Studio when program is paused, you can also do with memory dump.
| |
| | |
| Happy debugging!
| |
|
| |
|
| [[Category:DarkRadiant]] | | [[Category:DarkRadiant]] |
| [[Category:Coding]] | | [[Category:Coding]] |
DarkRadiant or TheDarkMod crashed? If you don't want that to happen again, you need to help the team to debug this malfunction --- you can do this by dumping process memory to a file, which can then be used by developers to debug and inspect the application's state at the point in time it crashed.
If a crash is reproducible, it might be enough to describe the exact steps that lead up to the fault and file a bug report on the bugtracker. But more often than sometimes crashes occur out of seemingly nothing and are barely reproducible, and in this case a saved memory dump is even more valuable for debugging purposes.
In principle, recording memory dumps is not limited to crashed applications. It is possible to record memory dump of alive process, although in most cases such dump would be useless.
Note: At the moment this only applies to the Windows OS, we don't know if there's something similar available for Linux environments.
Record the Dump
When application crashes, it usually shows a dialog like this:
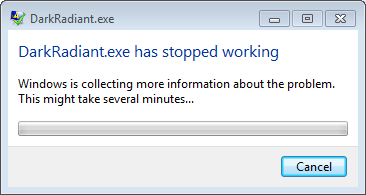
Note: If you don't get that window showing up for you (e.g. Windows 10), you'll probably need to re-enable that fix to make it show up again: https://superuser.com/a/1349113
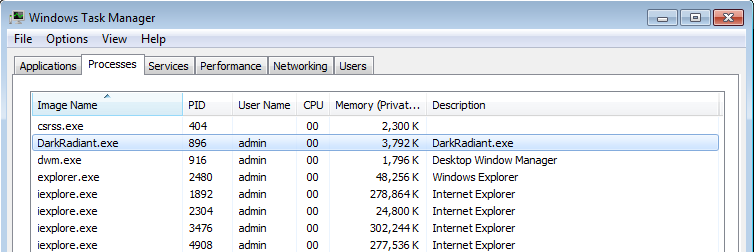
When it appears, keep that window open, don't close that dialog, instead open your Task Manager. To open the Task Manager, press Ctrl + Shift + Escape. Another way is to hit Windows + R and type "taskmgr" and click OK.
In the Task Manager, switch to the Processes tab and locate the program which crashed (DarkRadiant.exe, TheDarkModx64.exe or tdm_update.exe). It should be in that list since you still have the "XXX has stopped working" dialog open in the background.
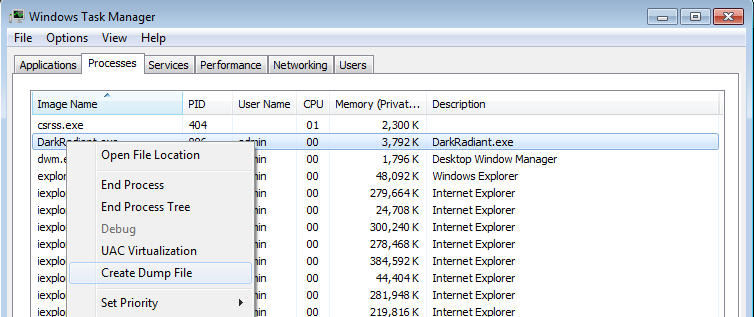
Now right-click the DarkRadiant.exe line and select "Create dump file":
It will work a bit and then show you something like this:
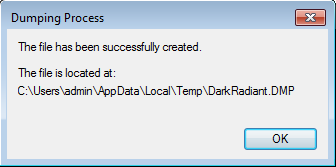
Open Windows Explorer and head to the location indicated in the dialog. Note that you can mark and copy the location from that dialog using your mouse, so you don't have to type it in entirely.
Compress and Upload the Dump
Depending on what you had opened in DarkRadiant or what FM you loaded in the game itself, the .dmp file might end up very large, so it's best to compress it now using 7-zip or by right-clicking it and selecting "Send to..." > "Compressed (zip) folder".
Upload that folder to some place in the web, and please go to the forums to tell the devs about your crash dump. Be thanked for your time, we know that recording and uploading crash dumps might be tedious, but without we really can't do much about the crash, so your help is appreciated!
Coders might want to check out the article on analyzing a memory dump.


