Displaying idLib types nicely in MSVC debugger
Custom visualizers
The MSVS can be configured to show TDM objects nicely in the watch using custom rules. As a result, you can directly expand e.g. idList, idLinkList or idDict to see all its elements. Also, you can expand idEntityPtr to see the entity you it references. These rules greatly facilitate MSVC debugging.
Installation
Currently all the TDM-specific rules are defined in /sys/msvc/natvis/*.natvis files in the SVN repo.
These files are automatically copied into %USERPROFILE%\Documents\Visual Studio 2013\Visualizers\ on each build,
so you don't even have to do anything to make them work.
Note that they are never deleted from the target directory, so if they disturb you in future, you have to delete them manually.
The source code also heavily uses boost library. In order to watch boost containers, you should install extension "C++ Debugger Visualizers for VS2013". Here are the steps to install the extension:
- Go to menu Tools->Extensions and Updates.
- Click on Online on the left pane to get to Visual Studio Gallery.
- Type "Debugger Visualizers" into the search bar in the top-right corner.
- Choose the extension, click on Download, then on Install.
- Finally, click on Restart Now button to load the extension.
Usage
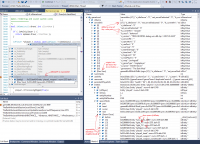
See picture on the right to get impression of how natvis changes the look of the watch.
Note that if you expand a value with a properly working custom visualizer, you will always see [Raw View] as the last item in it. If you expand it, then you will see the contents of the value visualized using built-in rules of the debugger (i.e. without custom visualizer applied). This is very helpful if you need to see the exact internals of a value.
Also, you can suppress custom visualizers by adding a special suffix in a watch.
For instance, if you have variable idList<idEntity*> corrupted, which you suspect is corrupted, then you can see its exact internals by typing corrupted,! into the watch.
Sometimes it might be useful to display data using customized view. For instance, if you use the "simple" view, then std::vector would have no [size] and [capacity] when expanded, and idLinkList would have no [Enum All] and [Enum Close] when expanded.
General tricks
Watching arrays
If you need to watch static-sized array (like int arr[256]), then by default all the 256 elements are shown in the watch. But in TDM you'll mostly come across dynamically allocated arrays (like int *arr = new int[256]). In this case debugger has no way to know the size of array, that's why it shows only one element. You can manually specify how many elements of the array to display for the pointer. Just type arr,240 into the watch, and you'll see exactly 240 first elements of the array.
