Analyze a Memory Dump
You received a crash dump and don't know how to analyze it? That's not a big deal, really. Don't get scared by numerous references to WinDbg and CDB in relation to memory dumps! You can open dumps directly in Visual Studio debugger.
Before starting, you might want to read Microsoft docs about memory dumps, so that understand what it is and what is included.
Learn version
First of all, you need to know which exact version of program the memory dump was obtained from. You should learn the exact state of source code, and build platform + configuration.
Here are some options:
- TheDarkMod final release: ask the TDM version, like 2.07.
- TheDarkMod beta release: ask when player has updated TDM last time. Or ask him to attach console dump. Or ask him to open game console and look at the revision number there.
- TheDarkMod developer build: ask developer about source code revision, platform and configuration.
Bitness is not important: you will know it immediately when you open the dump.
Get source code
Get the matching version of source code. In the case of TDM game or updater, you most likely need to switch to specific revision on the release branch/tag.
Get debug symbols
This is the hardest part: you need the debug symbols (i.e. the PDB files) for the binaries from which the memory dump was saved.
Every PDB and DMP file contains checksum of executable, and normally you cannot use PDB for memory dump if the checksums don't match, just like you cannot use a PDB to debug a program if it does not match. Merely rebuilding the project is enough to break PDB compatibility.
Here are some options:
- TheDarkMod final release: find PDBs in devel/release/debugging/X.YZ/ in assets SVN, and unpack them.
- TheDarkMod beta release: ask release manager to upload PDBs somewhere (he usually saves them).
- TheDarkMod developer build: ask developer to upload the matching PDB.
If you cannot get the original PDB but have the original executable, then you can also try to force-load freshly built PDBs. Here are the steps:
- Get exactly matching source code, compiler, target, configuration, whatever else.
- Build new binaries (fresh rebuild advised).
- Find the created PDB files and use chkmatch -m to substitute checksum inside PDB.
Of course, using mismatched PDB can lead to all sort of issues during debugging.
Action
Open the solution in Visual Studio (instructions written against VS2017).
In menu: "File -> Open -> File...". Choose the memory dump file.
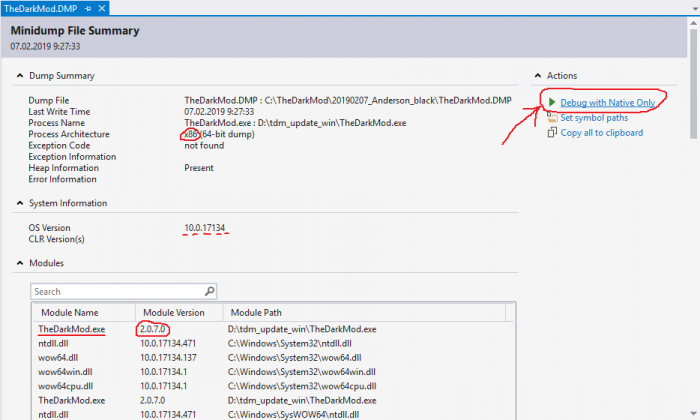
You will see some general info, most of which is useless. Click Debug with Native Only link in the top-right corner.
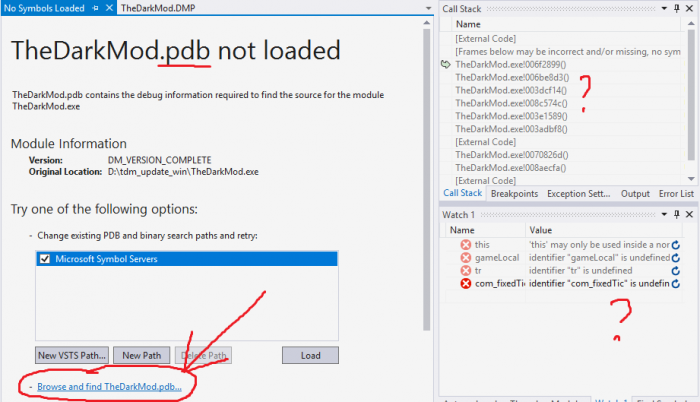
Most likely you will see this screen about missing PDB. Click on Browse and find xxx.pdb... link. Find the directory where the PDB file is located.
Visual Studio will accept debug symbols immediately when you open the directory containing them. Make sure the PDB files are unpacked.
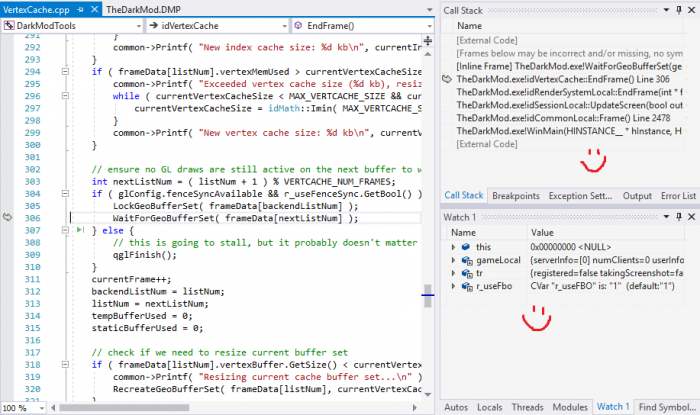
Now you should see where execution stopped, probably exception code also, You can navigate readable call stack, inspect global and local variables.
Everything you can normally do in Visual Studio when program is paused, you can also do with memory dump.
Happy debugging!


