Tracy: timeline profiler: Difference between revisions
Initial commit |
m Removed centering of images |
||
| Line 77: | Line 77: | ||
Now let's take a closer look at a single frame. | Now let's take a closer look at a single frame. | ||
[[File:Tracy Gameplay.png|960px | [[File:Tracy Gameplay.png|960px]] | ||
One important thing to understand regarding performance is that some things work in parallel. | One important thing to understand regarding performance is that some things work in parallel. | ||
| Line 114: | Line 114: | ||
==== Map load ==== | ==== Map load ==== | ||
[[File:Tracy Mapload.png|960px | [[File:Tracy Mapload.png|960px]] | ||
Loading every assets constitutes an individual activity on the timeline. | Loading every assets constitutes an individual activity on the timeline. | ||
| Line 124: | Line 124: | ||
==== Dmap compilation ==== | ==== Dmap compilation ==== | ||
[[File:Tracy Dmap.png|960px | [[File:Tracy Dmap.png|960px]] | ||
Latest revision as of 11:42, 28 August 2022
The typical developer's approach for analyzing performance is using the builtin sampling profiler in Visual C++. It provides the overall statistics for all the functions in C++ code, without requiring any markup. However, sampling profiler only collects average/cumulative information: it cannot reveal that one frame in 10 is 3x slower, or that a particular entity takes too much time thinking.
Since version 2.10, TDM ships with Tracy library integrated, which provides timeline profiling. It relies on manual instrumentation of C++ code, and shows exactly all the activities that developer wanted to see when he was doing the markup. It is very good at showing individual issues, like which single entity or area out of thousands takes too much time. Tracy profiling can be easily used by non-developers: you don't need to install Visual C++, and don't need debug information.
Preparation
Start TDM executable and set cvar com_enableTracing to 1.
When you first turn it on, it should print back the version of Tracy viewer that you need. Go to GitHub page of Tracy releases and download the main archive of the suggested version. The Tracy viewer inside is called simply Tracy.exe.
If TDM does not print version of Tracy for you, then you need either 0.7.8 (TDM 2.10) or 0.8.1 (TDM 2.11 dev builds). If you use Linux, then you'll have to build Tracy yourself.
Recording
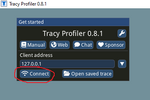
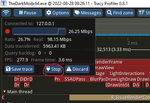
Here are the steps to record a trace:
- Start TDM.
- Start Tracy viewer.
- In Tracy viewer, click Connect button.
- In TDM, set com_enableTracing to 1.
- Do whatever you want to analyze in TDM.
- Switch to Tracy and click Stop button.
Here is your trace, ready for analysis. If you want to see the connection window again, click the "wifi" icon. From there you can Save trace on disk, or Discard + Reconnect to record a new trace.
Note that if you run TheDarkMod as administrator, you'll get a lot of additional low-level information, which you probably don't need.
Analysis
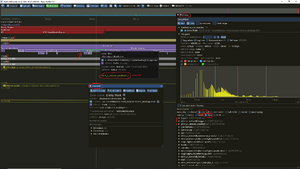
You see timeline: the sequence of all events happened during recording, and all activities executed during that. You can zoom timeline by mouse wheel and pan by dragging with right mouse button.
Every activity is represented as a colored interval on the timeline, its type is written inside the interval is you zoom to it. Activities are properly nested, for instance RunGameTic activity has ThinkAllEntities as a child, which in turns contains Think for individual active entities. Nesting is represented vertically: child activities are just below the parent activity. Also, the game has several threads, which are separated vertically: you can collapse and expand display of activities for every thread.
You can hover over an activity to see more info about it, and click it to see even more in a separate Zone info window. From this window, you can click Statistics button to open Find zone window. This window shows total/average/count/median/whatever time for all activities of the same type. Some activities have "User text" attached by programmer (like e.g. name of entity), which is displayed in yellow when you hover over activity. A useful feature is to click Group by User text and Sort by time in radio buttons.
Read the Tracy manual to learn more. It can be downloaded from Tracy releases page.
Typical workloads for analysis are:
- Gameplay: in this case you should record for at least a few seconds to get meaningful stats.
- Map load.
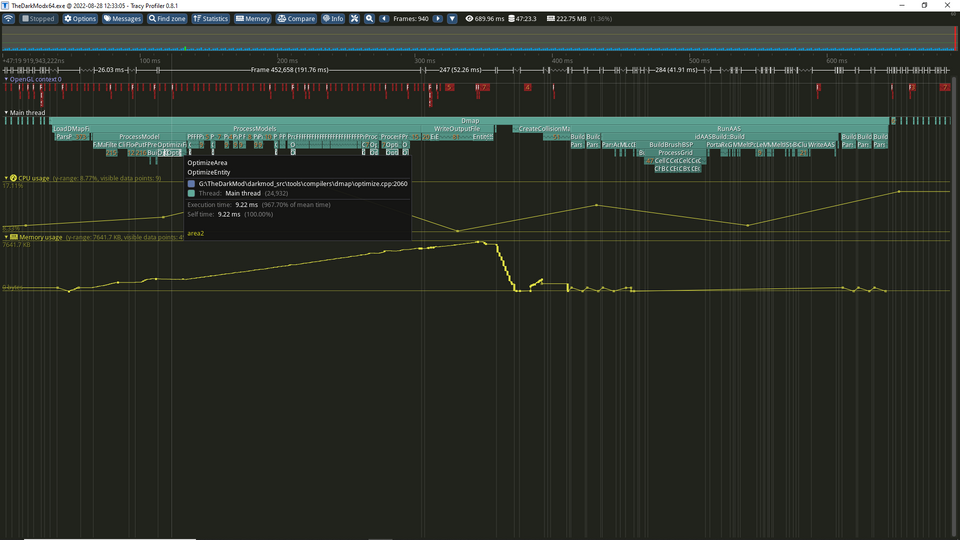
- Dmap compilation.
Gameplay

It is easy to see periodic structure of frames in the timeline. Tracy draws vertical lines where each frame ends, so you can easily see how much every frame took, what's current FPS. You can also see spikes in frame processing time on the "minimap" at the top.
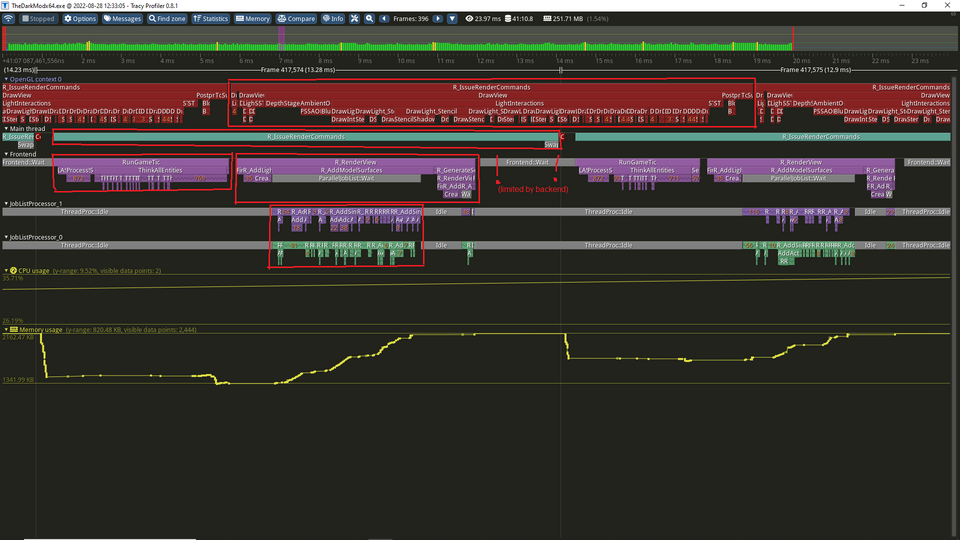
Now let's take a closer look at a single frame.
One important thing to understand regarding performance is that some things work in parallel. Suppose that task A takes 10 ms per frame, and task B takes 6 ms per frame, and you managed to optimize task B down to 3 ms. If the tasks are run one after the other, then you have optimized your frame from 16 ms to 13 ms. But if they work in parallel, the overall frame time remains 10 ms. The game would become visibly faster only if you optimized something on a thread which takes the most time (roughly speaking). This is usually called "bottleneck", "limited by frontend", "critical path", etc.
Tracy displays every thread as a separate vertical stripe, with the thread name displayed on the left. Parallel threads often need to wait for each other, doing nothing useful: such waiting activities are colored grey.
Here is description of the main threads and workloads (as of TDM 2.10):
- Frontend: runs a tic of gameplay modeling (RunGameTic), then renderer frontend (R_RenderView).
- Main thread: runs renderer backend (R_IssueRenderCommands), which interacts with OpenGL driver on CPU side.
- OpenGL context: GPU thread which actually executes OpenGL commands.
- JobListProcessor: some work is off-loaded to these worker threads.
Notice that rendering is split into three parallel tasks. Most of the work is done in frontend, which includes culling, particles, shadow volumes, animation, etc. Backend simply executes OpenGL API calls, letting OpenGL driver to do its stuff. Strictly speaking, OpenGL context is not a thread: it is the approximate view in what happens on the actual GPU device. For that reason, its activities are very special and not all Tracy features work for them.
The rule of thumb is: if you see WaitForFrontend at Main thread, then frontend thread is the bottleneck. If you see Frontend::Wait on Frontend thread, then backend thread is the bottleneck.
Here are a few other details which greatly influence performance:
- Some gameplay work is done only once in several frames. The most prominent example is AI thinking (see Interleaved Thinking optimization). While such work is randomly scattered across frames, the gameplay modeling time still varies a lot.
- When FPS drops below 60, frontend thread executes RunGameTic several times per frame, further reducing performance. However, all additional calls are cheaper because they almost totally exclude AI thinking (#5992).
Settings which greatly affect the timeline:
- Uncapped FPS menu setting switches between two different ways of time management (see Time, frames and ticks).
- com_smp allows to separate/merge Frontend and Main thread.
- Frontend Acceleration menu setting controls off-loading some frontend work to worker threads.
- Vertical Sync and r_finish changes the way backend/GPU synchronize with all the rest.
- com_useMinorTics, com_maxTicTimestep, com_maxTicsPerFrame control game modeling split behavior.
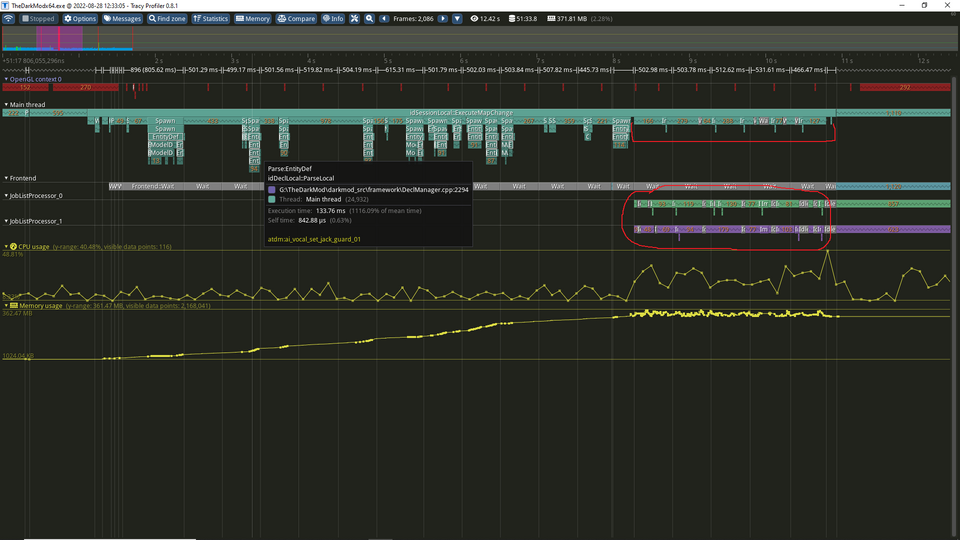
Map load
Loading every assets constitutes an individual activity on the timeline. Usually all the referenced subassets are loaded recursively, so they become nested/children activities. The major exception to this rule is images, which are loaded at the very end of the map loading, and in separate threads.
